


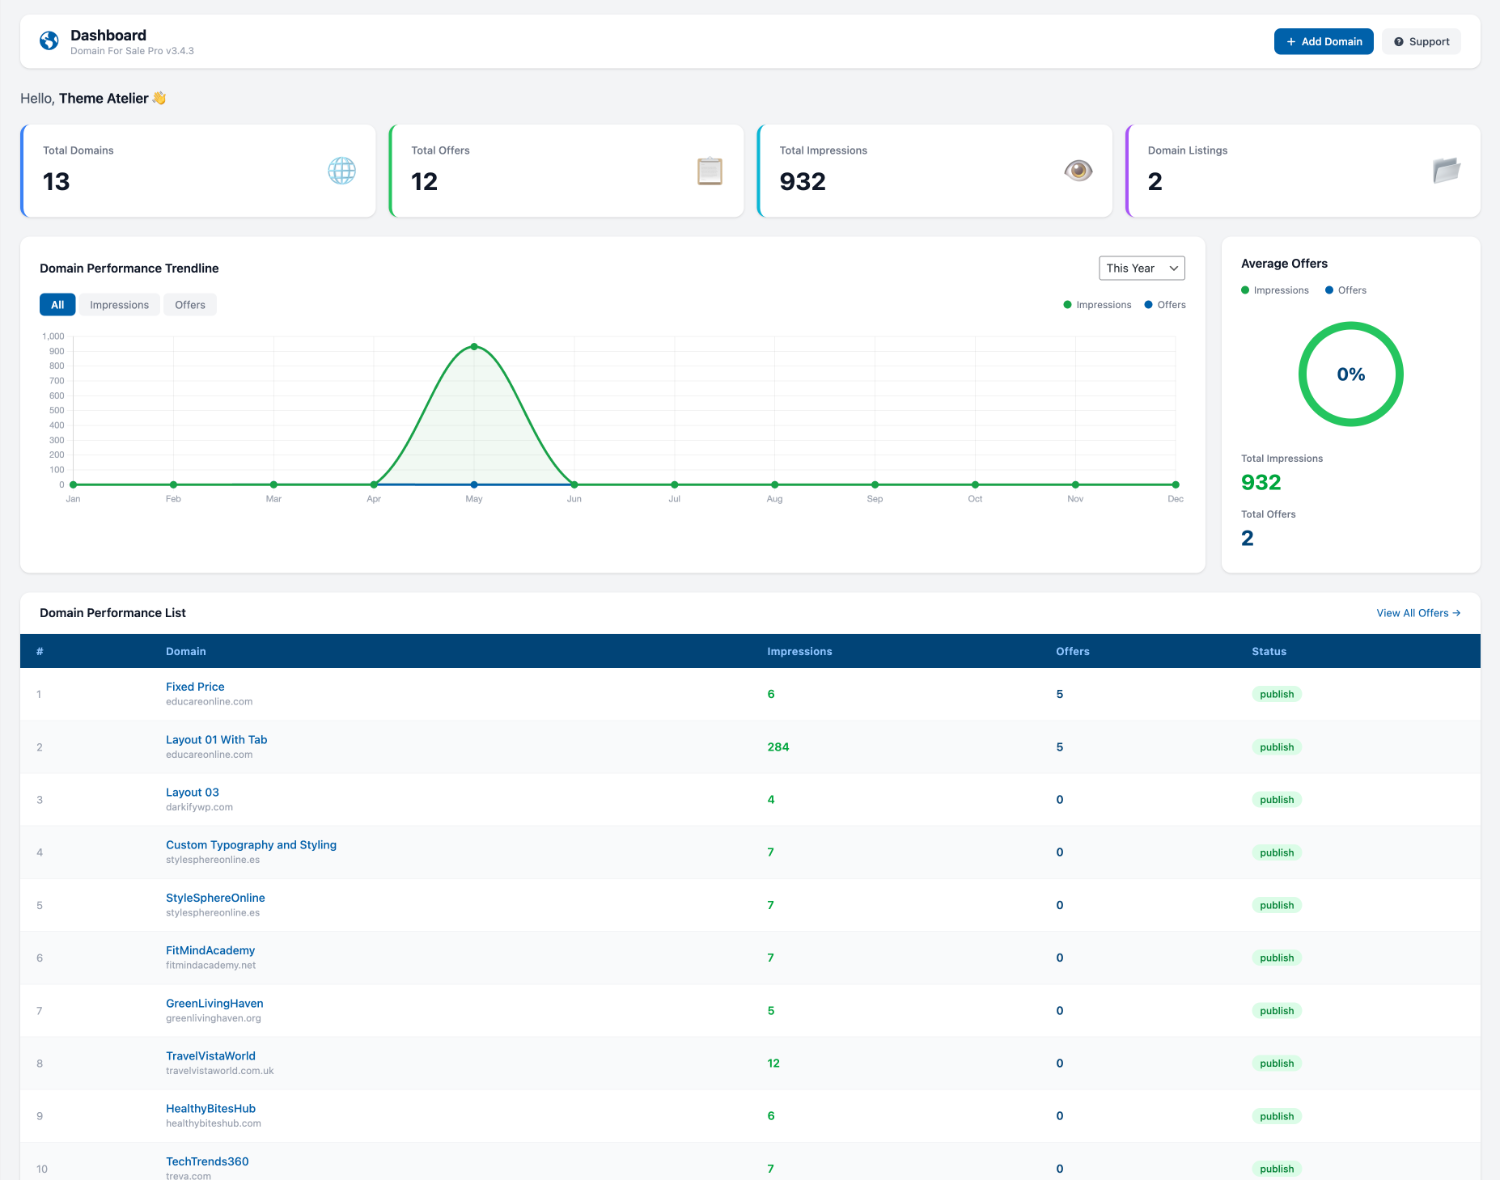
A React-powered Dashboard & Analytics page that gives you a real-time overview of your entire domain portfolio — impressions, offers, conversion rates, and per-domain performance — all without leaving WordPress.
Accessing the Dashboard #
Navigate to WordPress Admin → Domain For Sale. The Dashboard is the first item in the submenu and loads automatically when you open the plugin menu.
Capability required: Only users with the manage_options capability (Administrator by default) can view the Dashboard and call its REST API endpoint.
Dashboard Panels #
Stat Cards #
Four at-a-glance summary cards appear at the top of the page. All figures are all-time totals pulled directly from the database on each page load.
Domain Performance Trendline #
A Chart.js line chart plotting Impressions and Offers over time for the selected period. The chart refreshes automatically whenever you change the period or metric filter.
Period Selector #
Use the dropdown in the top-right corner of the trendline panel to choose a time window:
All Time | Today | Yesterday | This Week | Last Week | This Month | This Year | Last Year
| Period | X-axis granularity |
|---|---|
| Today / Yesterday | Hour (00:00 – 23:00) |
| This Week / Last Week | Day of week (Mon – Sun) |
| This Month | Day of month (1 – 28/29/30/31) |
| This Year / Last Year | Month (Jan – Dec) |
| All Time | Year (earliest record year – current year) |
Metric Tabs #
Three toggle buttons let you filter which data series are visible on the chart:
- All — both Impressions and Offers overlaid on the same chart.
- Impressions — page view trend only (green line).
- Offers — offer submission trend only (blue line).
Average Offers (Donut Chart) #
A side panel next to the trendline shows the offer-to-impression conversion rate for the currently selected period as an SVG donut chart.
- The percentage shown is
(total offers ÷ total impressions) × 100, rounded to the nearest whole number. - Below the chart, the panel also displays the raw Total Impressions and Total Offers figures for the selected period.
- The donut renders a green baseline ring (100 % background) with a blue arc representing the conversion share.
Domain Performance Table #
A sortable table at the bottom of the dashboard lists your top 10 most recently published domains with their individual performance metrics. Domains are sorted by offer count (highest first) before display.
| Column | Description |
|---|---|
| # | Row number. |
| Domain | Post title (links to the WordPress edit screen for that domain). Shows the configured domain name as a subtitle when set. |
| Impressions | All-time view count from wp_dfs_domain_views for this domain’s post ID. |
| Offers | Number of offers in wp_domain_for_sale_offers whose domain field matches this domain’s name. |
| Status | WordPress post status badge — publish or draft. |
When no domains exist yet, the table shows an Add your first domain prompt linking directly to the Add New Domain screen.
How Impression Tracking Works #
Every time a visitor loads a domain landing page (any DFS Template post), the plugin inserts one row into the wp_dfs_domain_views database table:
| Column | Type | Description |
|---|---|---|
id | BIGINT (PK) | Auto-incrementing record ID. |
domain_id | BIGINT | WordPress post ID of the viewed domain template. |
viewed_at | DATETIME | UTC timestamp of the page view. |
The table is created automatically on plugin activation (or on the first page load after upgrading to 3.4.0+). No manual setup is needed.
Caching plugins: Full-page caching (WP Rocket, W3 Total Cache, etc.) may prevent impression rows from being recorded for cached pages, since PHP is bypassed. Consider excluding your domain landing page URLs from your caching plugin’s cache rules if accurate impression counts are important.
REST API Endpoint #
The Dashboard fetches all its data from a single authenticated REST API endpoint:
| Detail | Value |
|---|---|
| Route | /wp-json/domain-for-sale-pro/v1/dashboard |
| Method | GET |
| Authentication | WordPress nonce (X-WP-Nonce header) — manage_options capability required |
| Query param | period — one of: all_time, today, yesterday, this_week, last_week, this_month, this_year, last_year. Defaults to this_year. |
Response Shape #
The endpoint returns a JSON object with the following top-level keys:
| Key | Type | Description |
|---|---|---|
stats | object | All-time counts: total_domains, total_listings, total_offers, total_impressions. |
chart | object | Period-filtered chart data: labels (string[]), impressions (number[]), offers (number[]). |
domain_performance | array | Up to 10 domain objects, each with: id, domain, domain_name, impressions, offers, status, url. |
user_name | string | Display name of the currently logged-in administrator. |
version | string | Plugin version string (e.g. 3.4.3). |
Top Bar Quick Actions #
The white header bar at the top of the Dashboard contains two shortcut buttons:
- Add Domain — navigates directly to Add New DFS Template in the WordPress admin.
- Support — opens the ThemeAtelier support ticket form in a new tab.
Frequently Asked Questions #
Why do my Impressions show 0 even though I have visitors? #
The most likely cause is full-page caching. When a caching plugin serves a cached HTML page, PHP (and therefore the impression-tracking code) does not run. Exclude your domain landing page URLs from the cache, or check whether your caching plugin supports cache-bypass for specific pages.
The chart shows no data for “Today” — is something broken? #
If you just installed or upgraded to 3.4.0+, the wp_dfs_domain_views table was created on that first load. No historic data exists yet. Impressions and offers will appear in the chart as they accumulate from that point onward.
Can I reset impression data? #
There is no reset button in the UI. To clear impression data, delete all rows from the wp_dfs_domain_views table directly in phpMyAdmin or via a database tool: TRUNCATE TABLE wp_dfs_domain_views; (replace wp_ with your actual table prefix).
Does the Dashboard slow down my site? #
No. The Dashboard is only loaded inside the WordPress admin area and is never included on the public-facing front end. The REST API query runs only when an Administrator visits the Dashboard page.
Can I give non-administrator users access to the Dashboard? #
The Dashboard is restricted to users with the manage_options capability. Granting this capability to additional roles is possible via a capabilities management plugin (e.g. Members, User Role Editor), but is outside the scope of Domain For Sale Pro.
The Domain Performance table only shows 10 domains — where are the rest? #
The table displays the 10 most recently published domains, then sorts them by offer count. This is intentional to keep the query fast. A View All Offers link at the top-right of the table takes you to the full Offers management screen.


